Build your own Pheno-calendar
with PhenoMap
A convenient educational tool for plant recognition and planting design.
A cross-platform web app for plant observers and citizen science.

What is phenology
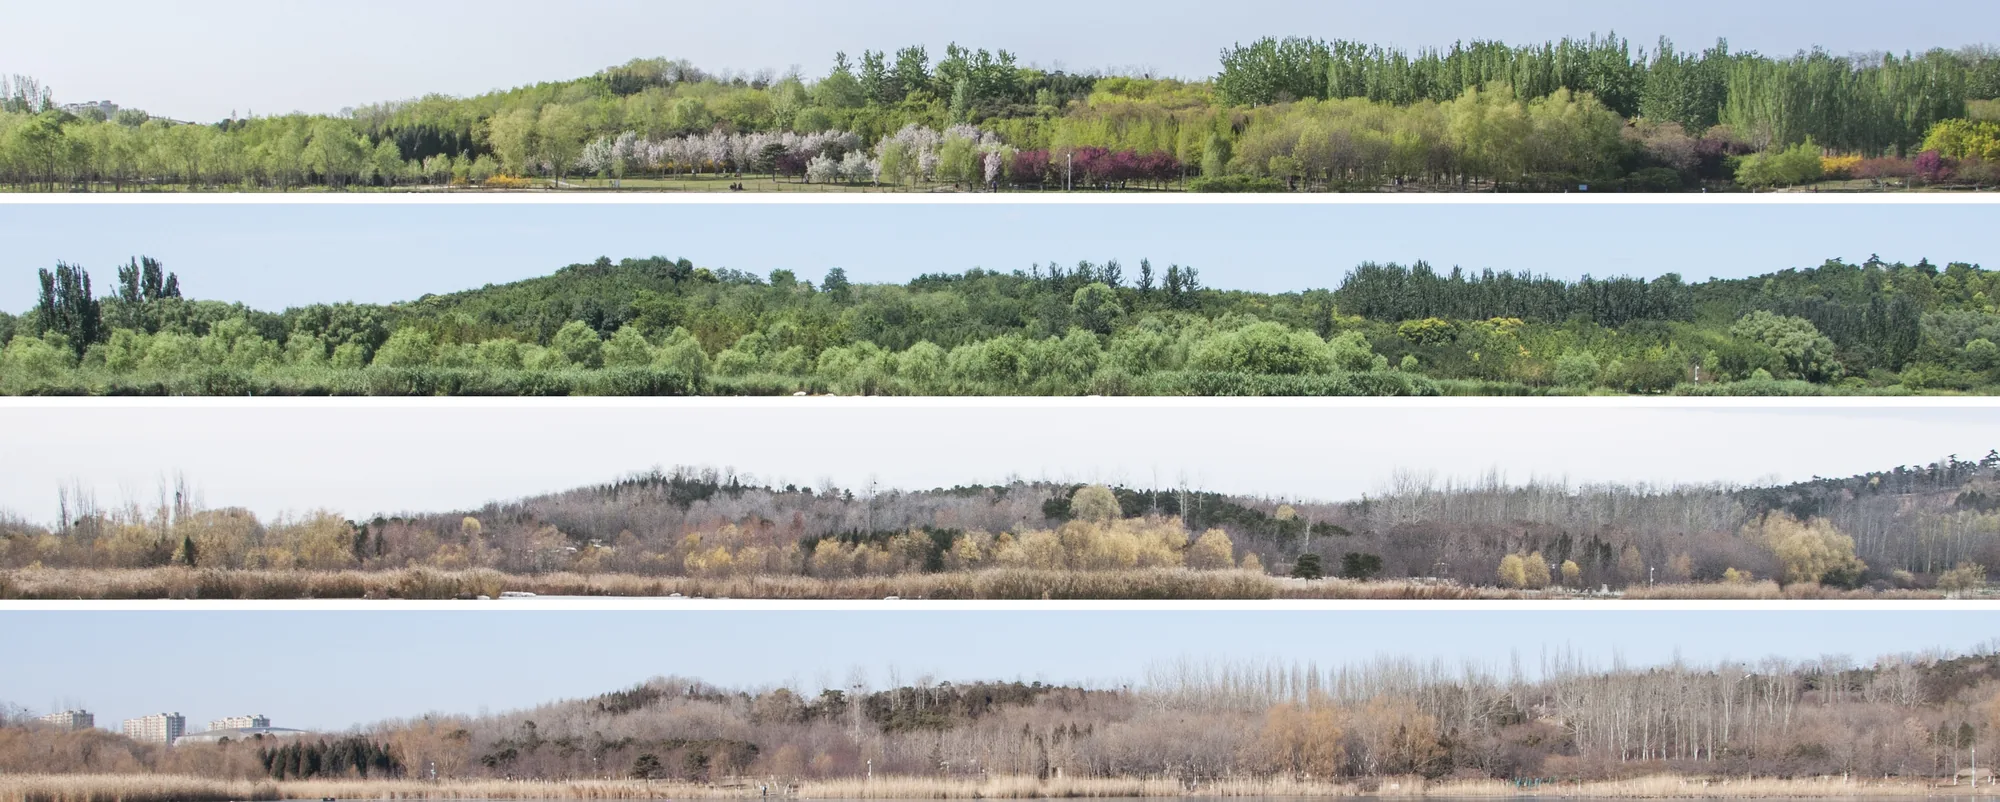
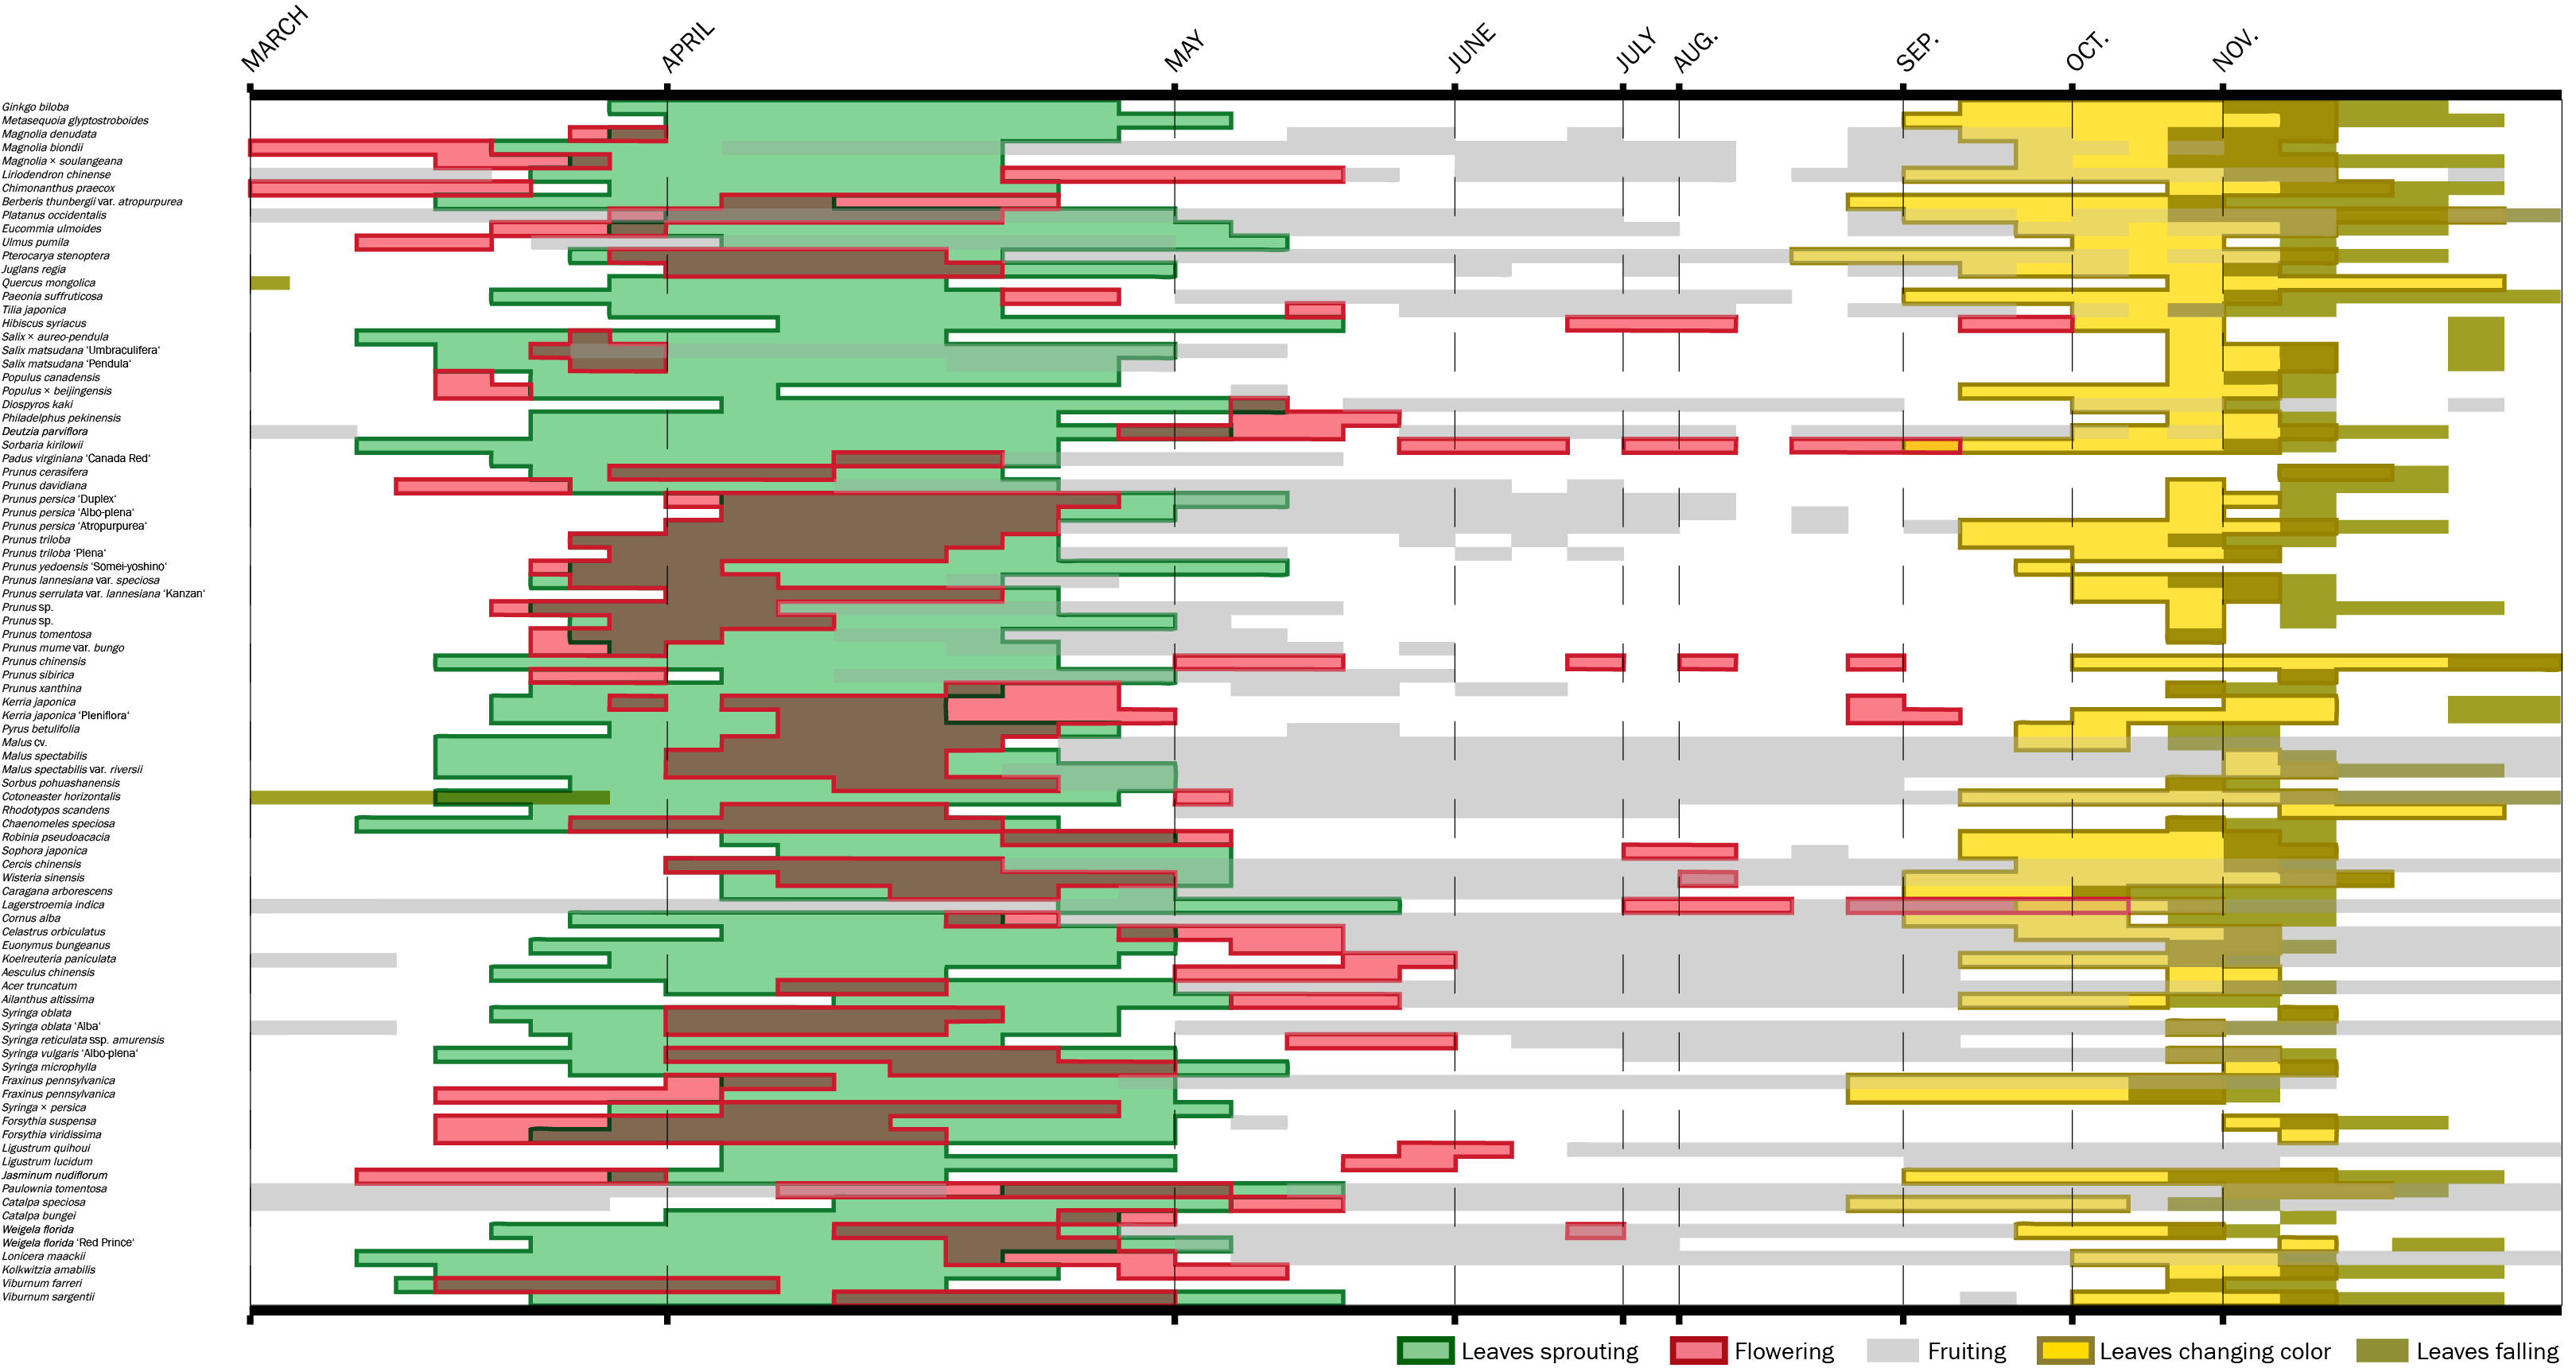
Phenology is the timing of the things a plant does through a year — when the first leaves break, when it comes into flower, when the fruit ripens and when the leaves finally go. It is among the oldest kinds of natural record, and it is made of very simple parts: a plant, a date, and what it was doing that day.
For planting design that timing is the difference between a plant list and a place. The same bed is four different spaces across a year, and the change is not a background condition — it is the material. A designer who knows the week each plant turns is working in a dimension a plan drawing cannot hold; without it, planting gets drawn as though the year stood still. Most designers pick that knowledge up anecdotally, from memory and a handful of site visits. Writing it down is what turns it into something you can design with, and hand on.
In the field
Recording a plant takes about two minutes. You pick out one individual and put it on the map, let the app help you name it, score what it is doing today — and then come back to it later. Every return visit is another point on that plant's calendar.
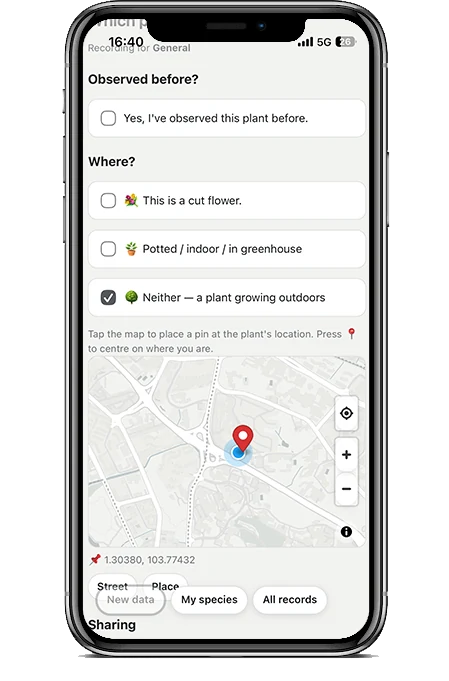
Locate the plant individual
Start with an individual: this shrub, not this species. Drop a pin where it stands and it stays yours to return to. Eight bushes along the same path are eight different plants with eight different flowering dates, and keeping them apart is what makes the record worth having.
Naming what you're observing
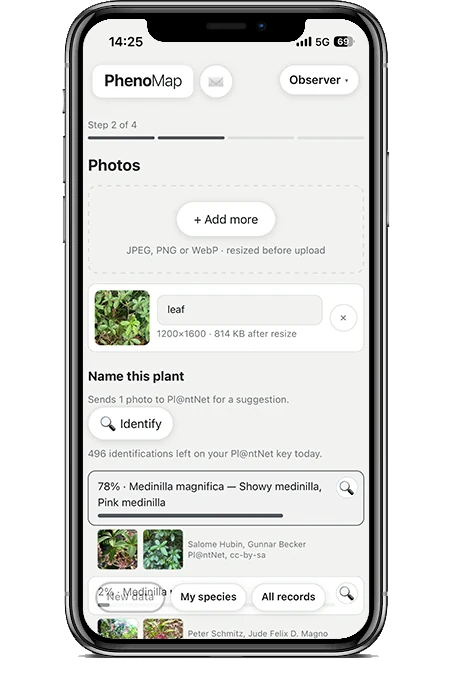
Take a few photographs and the app offers names, each with how confident it is. Take one of the suggestions, or type the name yourself if you already know the plant. Either way the record keeps track of how the name was arrived at.


Recording the phases
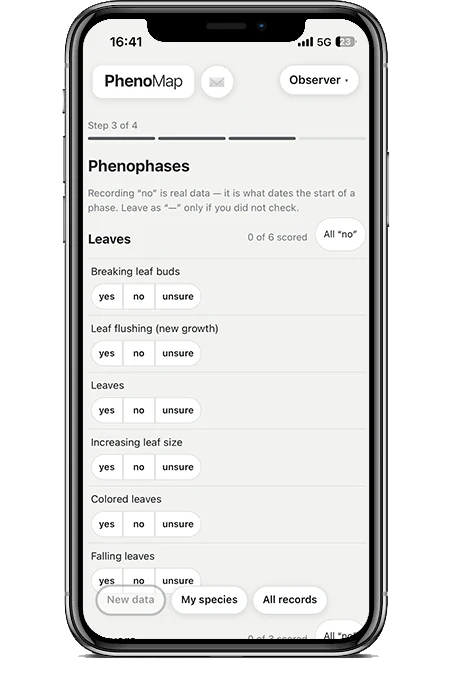
Up to twelve phases in three groups — leaves, flowers, fruits, or needles and cones for a conifer. Score each one yes, no or unsure, and say roughly how much when the answer is yes.
No is worth as much as yes: a no last fortnight and a yes today is what dates the beginning of flowering. A blank says nothing at all.
Observe again
Come back a fortnight later and record the same plant again. Each visit adds a dot to its year, and the dots are the whole point — one visit is an anecdote, a season of them is a phenology.
The calendar
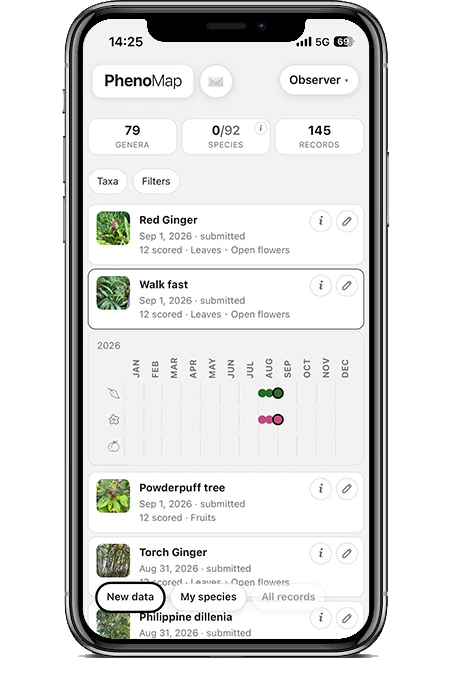
Every plant you record becomes a year-long timeline — three rows for leaf, flower and fruit, and a dot for each visit.
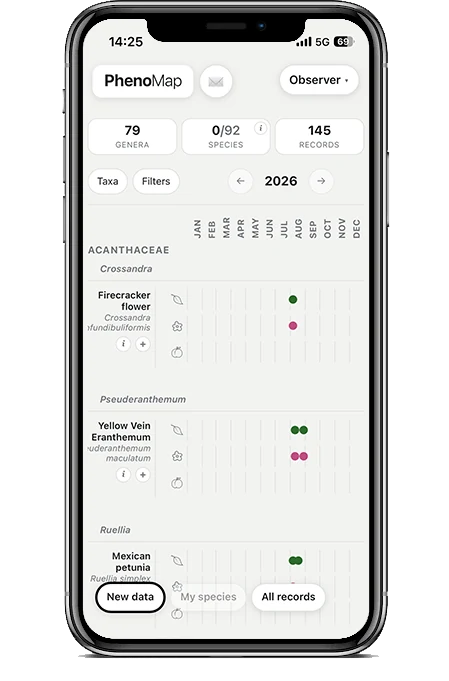
It is the one screen a teacher can read without asking anybody anything. Gaps are the months nobody went out. A plant with a single dot was never revisited. The calendar is the artefact of a season's work. Stacked by family and genus, a whole collection reads down one column of dots.
The map
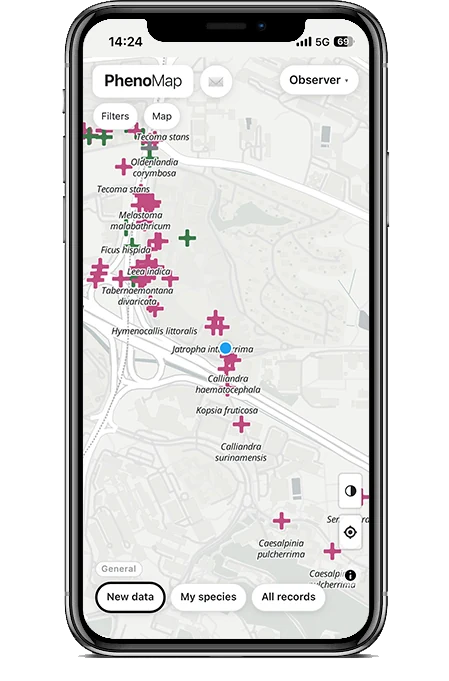
The map shows the plants where they grow, with the name under each mark and every + coloured by the most recent visit — pink for flowering, brown for dropping, green for in leaf, grey for nothing scored yet.
Tap a mark for the plant itself: what it is, how its name was arrived at, its photographs, and the whole timeline of visits to it.
Use it in a course
Build a cohort for your course. Everyone in it records into the same collection, so the class ends the semester with one shared calendar rather than thirty separate notebooks.
You can message your students from inside the app, and everything they collect for your course arrives in one place.
Reach out and we will help you set it up, and support it while it runs.
Your data your way
One file, one row for every phase scored. It is the shape a spreadsheet, R and pandas all want, so the first afternoon goes on the analysis rather than on reshaping the file.
Each row carries the plant, the visit and the score. Scored to USA-NPN definitions, so what you collect sits alongside other phenology work rather than only alongside itself. Yours to download whenever you like, licensed CC-BY-4.0.
Loading the sample file…
What it is built on
- Phenophase definitions from the USA National Phenology Network.
- Plant identification by Pl@ntNet.
- Basemaps from OpenFreeMap.
- Satellite imagery from Esri.
- Taxonomy and species keys from GBIF.
- Built with Claude Code.